A slow Power BI report is usually caused by one of four things: the visual, its DAX query, the semantic model or the environment serving it. The quickest route to a fix is to isolate which layer is slow, measure it, and change one thing at a time.
I use the sequence below because it stops performance work becoming guesswork. Do not begin by rewriting every measure or removing useful detail; first establish where the delay occurs and whether the problem is repeatable.
1. Define the symptom precisely
Symptom: “The report is slow” can mean the first page takes ten seconds, one slicer pauses, a table never finishes, or the Power BI service is slower than Desktop.
Cause: Those behaviours use different parts of the stack. A single slow visual suggests a query or design issue; every report slowing in the service suggests an environmental issue.
Fix: Record the page, visual, filter action, user, time and location. Test the same action twice in Desktop and the service. Note whether it affects everyone or one user.
2. Use Performance Analyzer
Symptom: A page contains several visuals and it is not obvious which one holds everything up.
Cause: One visual can issue an expensive DAX query, spend time rendering, or wait while other page interactions run.
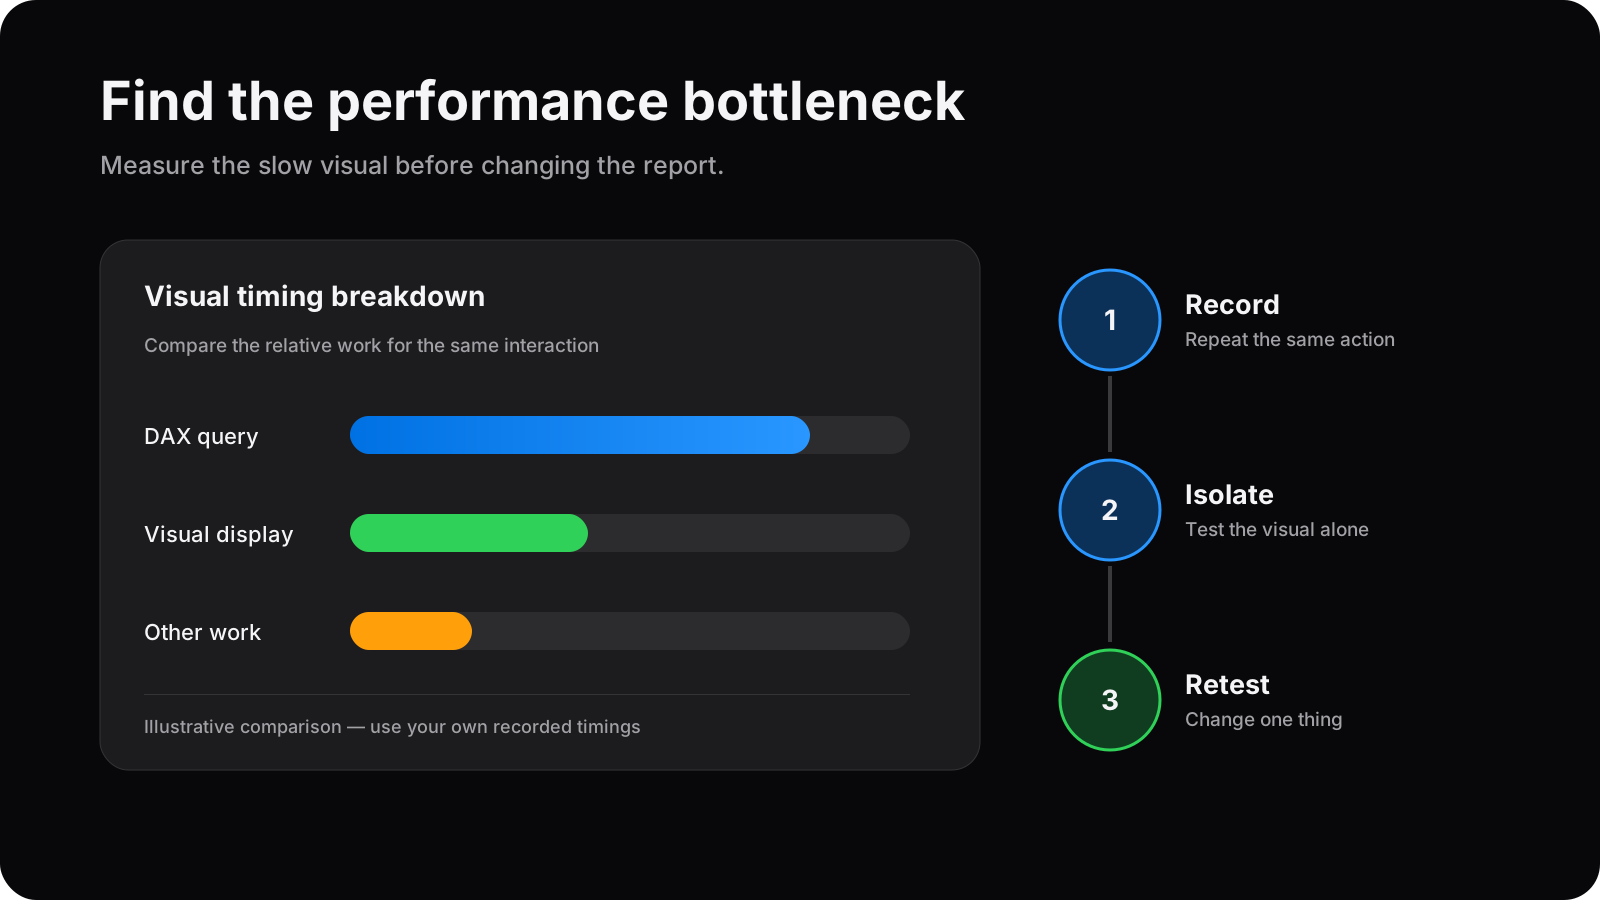
Fix: In Power BI Desktop, open Performance Analyzer from the Optimize ribbon, select Start recording, then refresh the visuals. Expand each result. Compare DAX query time with visual display and other time, and repeat the test so a one-off start-up delay does not mislead you.
3. Test the slow visual on its own
Symptom: A matrix, detailed table or custom visual is much slower than the rest of the page.
Cause: The visual may request too many data points, use several expensive measures, or trigger unnecessary interactions with other visuals.
Fix: Duplicate the page, keep only the suspect visual and retest. Temporarily remove fields and measures one by one. Check whether the business really needs every column, row and conditional format. Limit detail at the overview level and provide drill-through where detail is genuinely useful.
4. Check filter and visual interactions
Symptom: Selecting one chart causes several seconds of activity across the page.
Cause: Every relevant visual may be recalculating, even when an interaction adds no value. High-cardinality slicers can also generate heavy queries.
Fix: Use Edit interactions to disable interactions that are not required. Replace long free-form lists with sensible grouped filters where that matches the reporting need. Keep the page focused rather than placing every possible question on one canvas.
5. Inspect the data model
Symptom: Many measures are slow, not just one visual.
Cause: A wide flat table, unnecessary high-cardinality columns, ambiguous relationships or excessive bidirectional filtering can make queries harder to resolve.
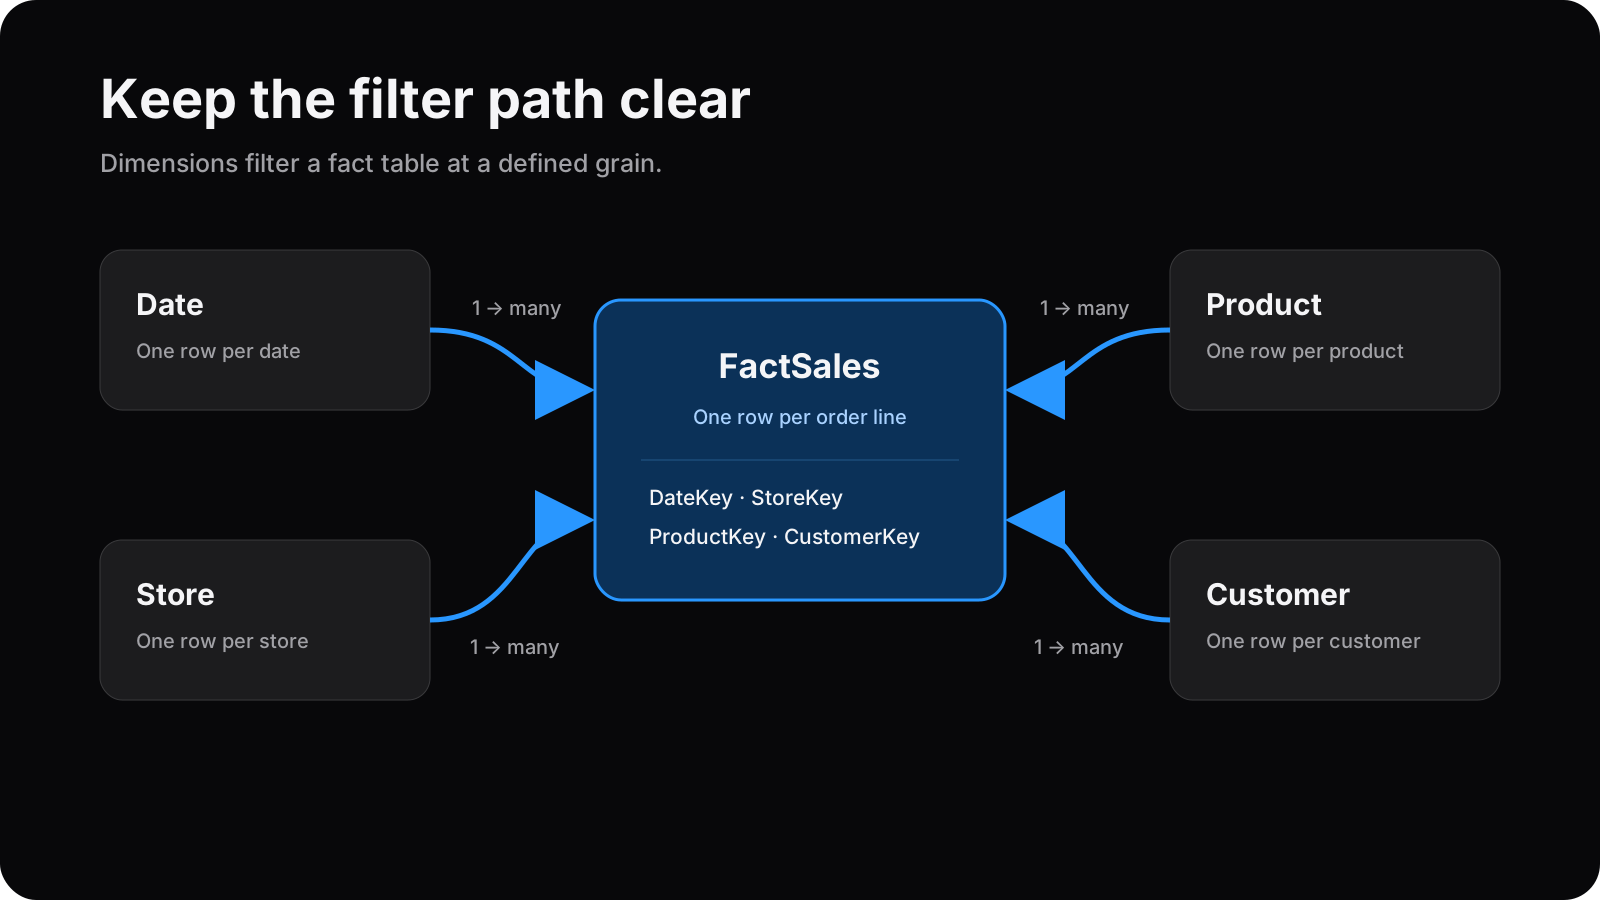
Fix: Prefer a clear star schema with fact tables at a defined grain and dimensions used for slicing. Remove columns that are not needed for reporting, use active one-to-many relationships where appropriate, and only use bidirectional filtering when the requirement justifies it. If the model is unclear, map the relationship path before touching DAX.
6. Review the measure in its real context
Symptom: A particular measure becomes slow when a detailed field is added or a broad date range is selected.
Cause: Iterators over large intermediate tables, repeated calculations, complex filter removal or logic at the wrong grain can increase work sharply.
Fix: Copy the visual’s DAX query from Performance Analyzer and identify which measure drives the delay. Test the base measures separately. Use variables when an expression is genuinely reused, and calculate at the grain required by the business question. Do not replace correct logic with a faster result that means something different.
7. Separate model speed from source speed
Symptom: Editing or refreshing data is slow, while report interaction may be acceptable—or DirectQuery visuals pause whenever they are used.
Cause: Power Query transformations may not fold to the source, the source may be overloaded, or a DirectQuery request may be waiting on the database and network.
Fix: For import models, filter rows and remove unused columns as early as practical, and check query folding where the connector supports it. For DirectQuery, capture the source query and examine source performance with the relevant database owner. A report redesign cannot compensate for an unavailable source.
8. Compare Desktop, service and gateway behaviour
Symptom: The PBIX performs well locally but is slow after publication.
Cause: Network distance, an on-premises gateway, concurrent usage or capacity pressure may be involved rather than the report file itself.
Fix: Test the same page with the same filters and account. Check gateway health and recent service behaviour. If several unrelated reports slow at the same time, involve the tenant or capacity administrator. Preserve your before-and-after timings so the improvement is evidenced.
Make the smallest evidenced change
Once you have a likely cause, change one component and rerun the same test. Keep a simple record of the page, action, timing and result. This makes it easier to separate a real improvement from cache effects or normal variation.
If the investigation points to model design or DAX, my Power BI DAX and data modelling service covers that layer. The multi-site retail case study shows how a structured reporting solution can support consistent operational analysis without adding unsupported claims to the diagnosis.
Frequently asked questions
Why is my Power BI report suddenly slow?
Start with what changed: data volume, a visual, measure, relationship, source, gateway or service environment. Reproduce the issue and use Performance Analyzer before changing the model.
How do I find the slowest visual in Power BI?
Open Performance Analyzer in Desktop, start recording and refresh the visuals. Compare durations, expand the entries, then test the slow visual on its own.
Does too much data always make Power BI slow?
No. Model shape, column cardinality, DAX, relationships and visual design can matter as much as row count. Measure the bottleneck instead of assuming size is the only cause.
Can a Power BI Health Check help with performance?
Yes. A focused review can examine report behaviour, the model, DAX and refresh setup, then prioritise changes supported by evidence.
Need a measured view of the problem?
I can review the report, model and refresh setup, identify the likely bottlenecks and give you a prioritised action list.
Book a Power BI Health Check