Your DAX total may look wrong because Power BI recalculates the measure in the total row’s filter context; it does not normally add the numbers displayed above it. Before forcing the total to sum the rows, decide what the total should mean at the overall level.
This distinction matters. For an additive value such as sales, the two results may match. For percentages, averages, thresholds and conditional measures, adding visible rows can produce a number that is mathematically or commercially wrong.
1. Write down the expected total
Symptom: The matrix total differs from the sum you calculate by eye.
Cause: “Total” is ambiguous. You might want total sales, an overall margin percentage, an average across all orders, or a sum of separately capped category results.
Fix: State the rule in plain English and test it with a tiny example. If three categories show 40%, 20% and 10%, should the total really be 70%, or should it be calculated from total profit divided by total sales? The answer determines the DAX pattern.
2. Understand the total filter context
Symptom: Every detail row is correct but the grand total follows different logic.
Cause: On a category row, the category filters the model. On the grand total, that individual category filter is absent, although slicers, page filters and other context remain. The measure is evaluated again against that broader set of rows.
Fix: Read the measure as a calculation, not a stored cell. Ask: “Which filters exist on this row?” Use a temporary table visual containing the grouping columns and simple base measures so you can see where the context changes.
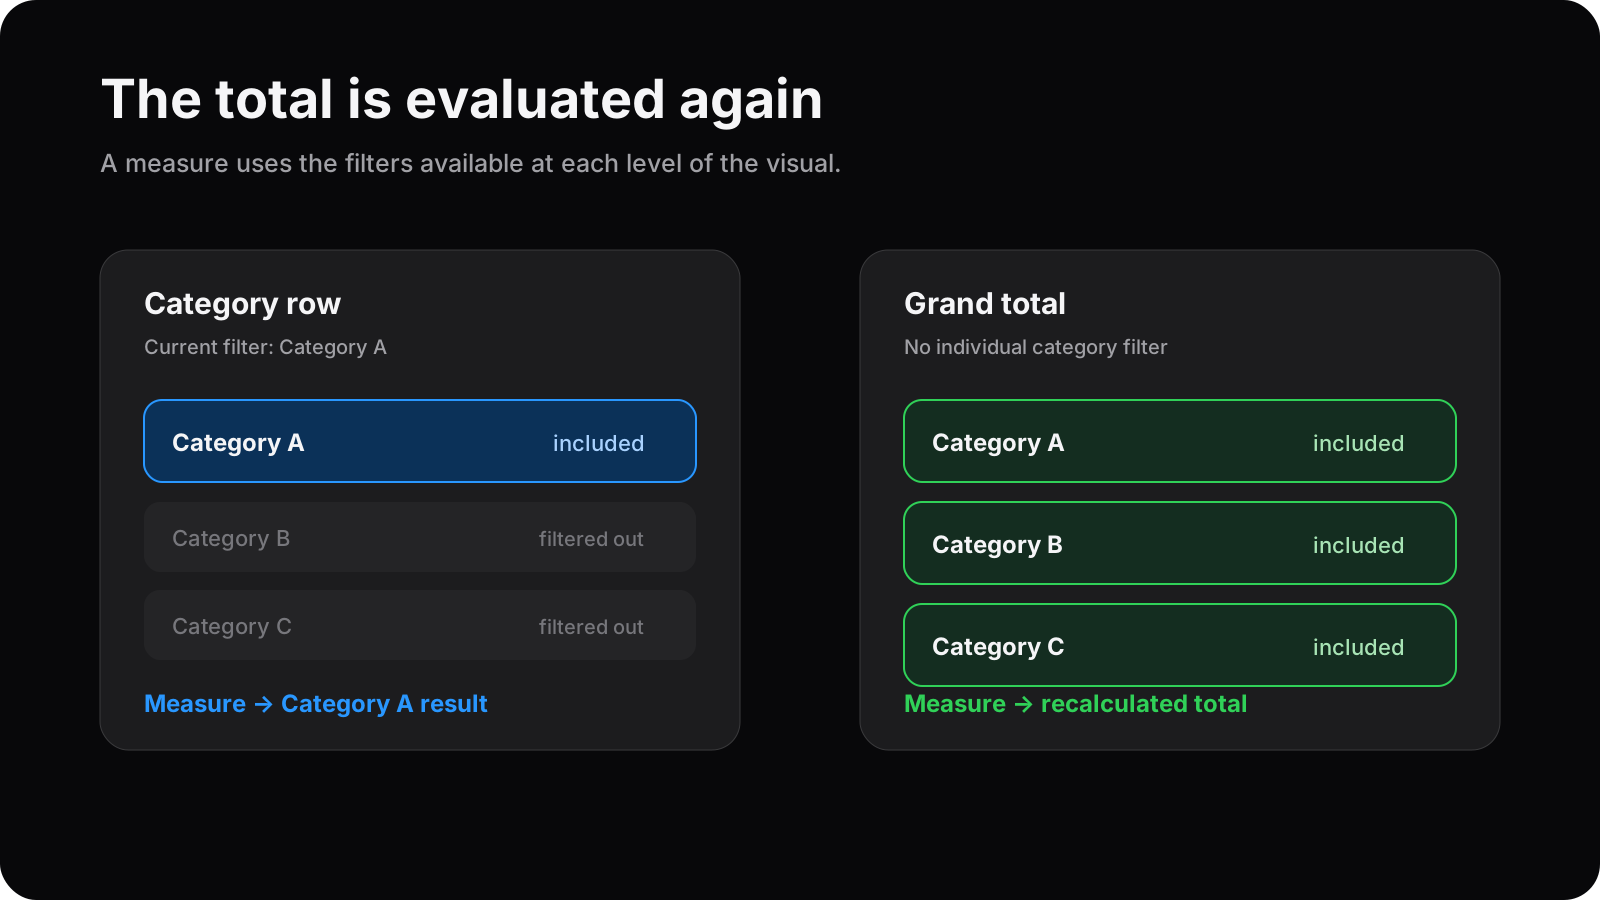
3. Check whether the recalculated total is actually correct
Symptom: An average or ratio total does not equal the sum—or simple average—of the row values.
Cause: Ratios are normally non-additive. The correct overall result uses the overall numerator and denominator.
Fix: Build and test the component measures. For average order value, this measure is normally more meaningful than adding category averages:
Average Order Value =
DIVIDE ( [Sales Amount], [Order Count] )
At the total, both component measures are recalculated for all orders in the current context. That is expected behaviour, not a broken total.
4. Validate the base measures first
Symptom: The final measure is complex and it is unclear which part causes the difference.
Cause: A total can expose an error in a base measure, such as a denominator using the wrong filter removal or a count being taken at the wrong grain.
Fix: Put the numerator, denominator and final result next to each other in a test visual. Add the key dimension fields gradually. Check blank handling and use DIVIDE for division where its alternate-result behaviour suits the requirement. Keep formatting separate from the numeric business logic.
5. Check the grain and relationships
Symptom: Totals change unexpectedly when a field from another table is added.
Cause: The grouping column may not filter the fact table as expected. Inactive relationships, many-to-many joins, ambiguous paths or facts at mixed grains can all alter the rows included.
Fix: Identify the fact table grain: one row per transaction, order line, monthly balance or something else. Trace the active relationship from the displayed dimension to that fact. Confirm the key is unique on the one side. Do not try to repair an unclear model solely with a more complicated total measure.
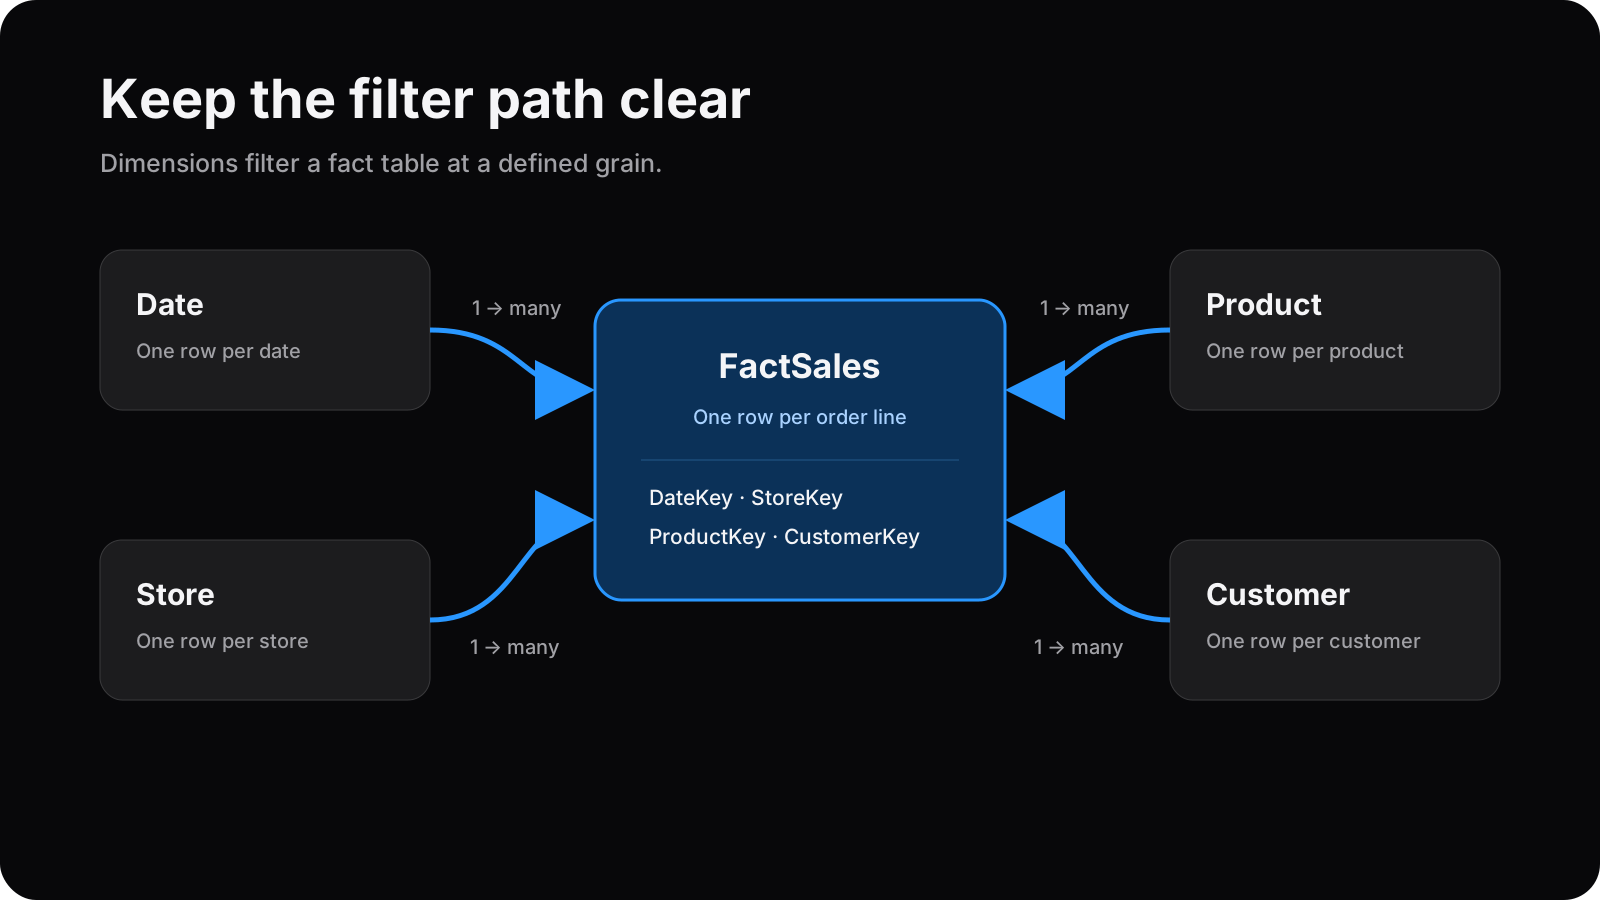
6. Sum displayed results only when that is the rule
Symptom: The business definition explicitly requires the total of a calculation performed separately for each category.
Cause: The measure at the total is currently evaluated once over all categories, while the rule requires iteration at category grain.
Fix: Iterate over the required visible items and evaluate the base measure for each one:
Total of Visible Categories =
SUMX (
    VALUES ( Product[Category] ),
    [Base Measure]
)
Replace the table, column and measure with the model’s real names. This pattern is correct only when category is the intended calculation grain. If the matrix can drill to product or region, define how the measure should behave at each level before extending it.
7. Treat scope checks as a deliberate choice
Symptom: The calculation needs one behaviour for detail rows and another for a subtotal or grand total.
Cause: The visual contains a hierarchy, so the appropriate business rule genuinely changes by level.
Fix: Functions such as ISINSCOPE can detect the current hierarchy level, while HASONEVALUE answers a different question about filtered values. Use them after the rules for each level are documented. Do not add a generic “if total then SUMX” branch to every measure; it can be slower and semantically wrong.
8. Test outside the production visual
Symptom: Conditional formatting, drill state and many fields make the result difficult to reason about.
Cause: The presentation hides the context that is driving the measure.
Fix: Build a temporary validation page with a plain table, the smallest useful set of dimensions and the component measures. Apply the same slicers as the original. Test one category, several categories, no selection and the grand total. Once the numbers are correct, return the measure to the designed report.
A total is a business definition, not a formatting option
The most reliable fix starts with the meaning of the number. I separate the business rule, model grain, filter context and presentation. That makes the final DAX easier to explain and less likely to fail when somebody adds a slicer or drills to another level.
If the issue sits deeper than one measure, my DAX and data modelling service covers model structure and measure logic together. You can also see the reporting context in the multi-site retail Power BI case study.
Frequently asked questions
Why does a Power BI total not equal the visible rows?
A measure is evaluated again in the total row’s filter context. Power BI does not automatically add the displayed results, and for ratios or averages the recalculated total is often correct.
How can I sum the visible DAX results?
When that is genuinely the business rule, iterate over the required visible grain with SUMX and VALUES, evaluating the base measure for each item. Confirm the grain first.
Should I use HASONEVALUE or ISINSCOPE for every total?
No. They can support level-specific behaviour, but first define what the total means. Branching around a misunderstood measure can hide a modelling problem.
Can relationships cause an unexpected DAX total?
Yes. An inactive, ambiguous or many-to-many relationship can change which fact rows are filtered. Validate the model and grain before rewriting the measure.
Need the measure and model reviewed together?
I can trace the filter context, validate the business rule and prioritise changes without inventing a new definition for your numbers.
Book a Power BI Health Check